

How to Set Up an Automated Dashboard That Drives Profit, Not Just Reports
You don’t need more numbers.
You need numbers that help you move faster, smarter, and with a lot less second-guessing.
If you’ve already set up your KPIs and started gathering the data to track them, you’re headed in the right direction.
Now it’s time to connect it all with dashboards that don’t just show you what’s happening — they help you make better calls, faster.
Whether you’re building your first dashboard or fine-tuning one that’s been collecting dust, this guide will walk you through the strategy, tools, and real-world tips to turn your data into real growth.
Start with Strategy
Before you start clicking around in tools and building dashboards, you need to step back and get clear:
What are you actually trying to make better?
Think of it like this: your dashboard isn’t just a scoreboard. It’s a decision-making tool. And if you don’t know what decisions you want to make, even the best dashboard will just collect dust.
Here are three questions to lock in before you build anything:
- What decisions do we need to make from this data?
- Who needs to see it — and how often?
- What outcomes are we actually trying to improve?
Dialing in your strategy first makes sure your dashboard drives real action, not add more noise.
Dashboards That Drive Action
Once you know what you’re tracking, it’s time to bring those numbers to life, not just stare at them.
A dashboard that actually works isn’t about cramming every stat into one screen. It’s about making action easy. Your dashboard should be able to:
- Highlight your top KPIs at a glance
- Let you filter by team, timeframe, or goal
- Show the right people the right data (no clutter, no confusion)
Think of it like a business command center. If your dashboard’s doing its job, it should answer your key questions before you even have to ask them.
High-Impact Dashboard Design Tips
If you want dashboards that drive decisions (not just look pretty), keep it simple:
- ✅ Limit each view to 5–7 core metrics
✅ Use real-time reporting tools (no more copy-paste madness)
✅ Create a clear visual hierarchy (big wins stand out, noise fades back)
✅ Set up alerts so your team knows when something’s off before it snowballs
Smart dashboards aren’t overloaded dashboards. They’re fast, focused, and built to help you lead, not second-guess.
Pick the Right Tools for the Job
There’s no shortage of automation tools out there, but not all of them are a good fit for every business.
Your dashboard is only as good as the systems powering it.
That’s why picking the right tools isn’t about what’s cool.
It’s about what fits your use case, your team’s capacity, and your integration needs.
Here’s a quick look at how some of the top reporting tools stack up:
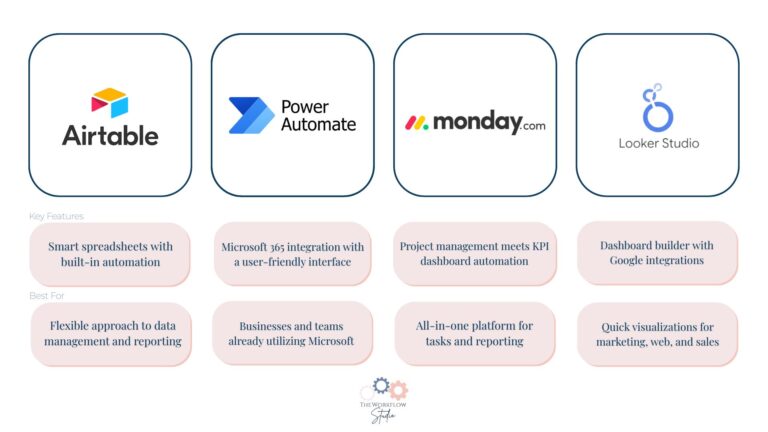
You don’t need the fanciest platform. You need the one that makes it easier for your team to move faster, see clearer, and scale smarter.
Quick-Start Automation Blueprint
Now let’s tie it all together. Whether you’re automating for the first time or refining an existing workflow, this structure will set you up for success:
- Collect the Right Data Start with forms, your CRM, or spreadsheets, whatever you’re already using to track the real stuff that matters.
- Set Up Automation Rules Use tools like Make or Monday.com to move that data automatically. No more manual updates. No more bottlenecks.
- Visualize the Metrics Push your clean, organized data into a dashboard platform you (and your team) can actually read at a glance.
- Distribute the Insights Send out a weekly digest or trigger real-time alerts to key players when things are moving (or not moving) the way you want.
Dashboards aren’t magic. They’re tools — and the real magic happens when your team can use them without friction.
Pro Tip 🚀 Add a quick video walkthrough or a simple onboarding guide showing your team how to actually use the dashboard. Even the best reporting system won’t help if your people don’t know what they’re looking at.
Make Reporting Work for You
Automated dashboards aren’t about replacing people. They’re about freeing your team to focus on what actually moves the business forward. When you’ve got the right tools, the right metrics, and the right delivery systems in place, your dashboards stop being “just reports”, and start becoming real growth engines. Ready to build a dashboard that works as hard as you do? We’ve helped dozens of service businesses turn scattered reports into streamlined, decision-ready dashboards, and we’d love to help you do the same. 📆Book a free strategy call and explore how much time, clarity, and momentum you can unlock with smart automation and AI. Let’s build something powerful, together.About The Author


Sarah Bronkema
Sarah Bronkema is a consultant specializing in Monday.com and No Code Integration solutions, helping businesses streamline workflows through automation. With over a decade of experience in building efficient systems, she combines her analytical mindset and tech expertise to simplify operations for growing companies.
Her experience spans building a multi six-figure logistics agency and managing complex operations, where she honed her skills in optimizing processes. With a B.B.A. in Business Management, Sarah pivoted into consulting, combining strategy with technology to simplify operations and drive sustainable growth. She’s passionate about empowering business owners to work smarter, reduce internal workloads, and focus on what matters most.
Other Posts You May Like